Business context
The client is a telecom tower software company. It sells a SaaS platform to tower owners and operators who manage towers, site equipment and related critical assets. Their tower IoT and operations data was not linked to the physical asset, and the product needed to close that gap to serve its customers.
The challenge
Tower owners and operators switched between systems to see tower sites, equipment and performance. They needed one view to manage the operations and lifecycle of their towers. That meant joining 3D tower models, map-based site data and streaming IIoT data in one browser application.
Our solution
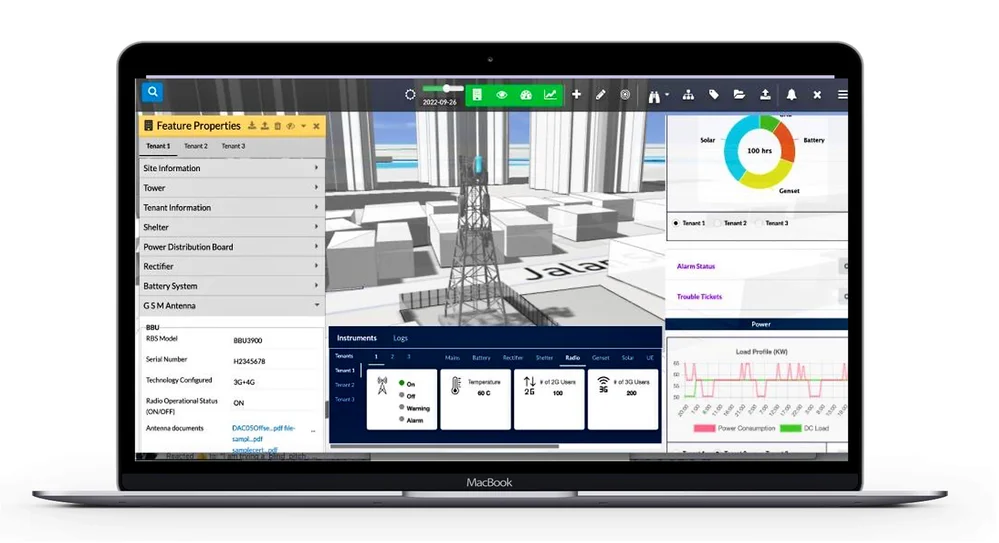
We developed a SaaS digital twin platform on Mapbox, three.js, Meteor and React. It combines interactive 3D views of towers and sites with IIoT data, cloud pipelines on AWS and Azure, analytics, KPI dashboards and alerts.
- Live status of each tower in a 3D environment
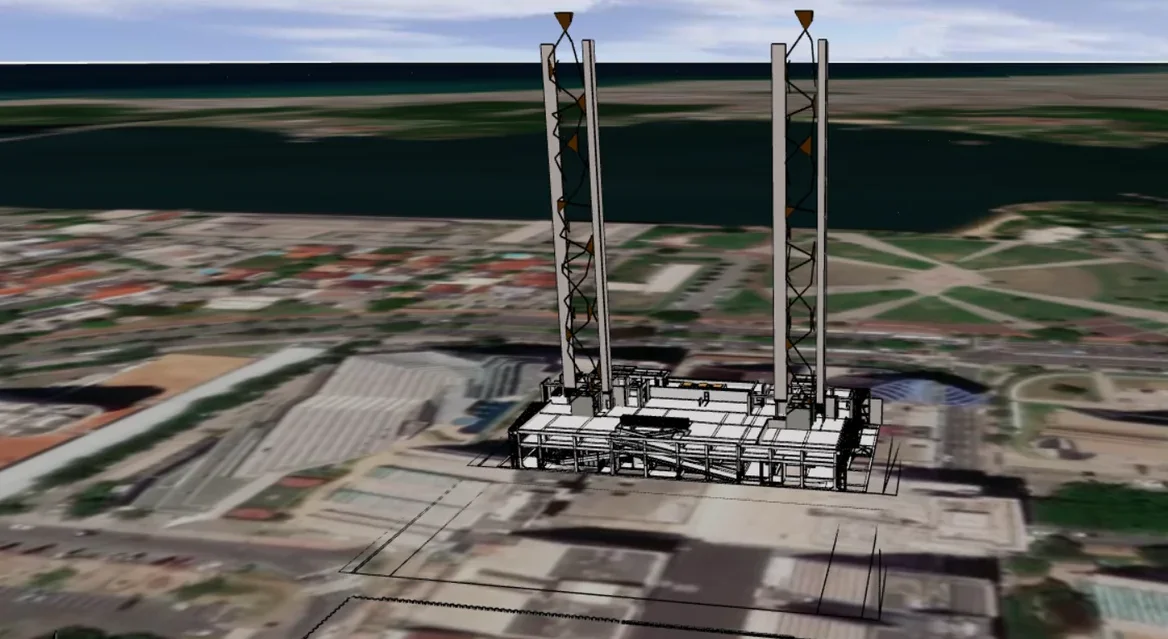
- Loading of 3D tower models, with 3D data import and export
- Physical infrastructure including shelters, rectifiers, batteries, gensets and fencing
- Instrument panel and feature or tower panel
- Heatmaps on the map and ray-tracing based coverage analysis
- KPI dashboards per tower and site, with alerts on asset performance
- Power and energy reports, traffic activity and radio activity
- Unified data view for asset planning, tracking and capacity planning
Business impact
Performance improvement and cost optimization.
- Operations teams can act on a performance problem knowing exactly which tower and which equipment it affects
- Planners make capacity and investment decisions from one dataset instead of exports from separate tools
- Energy and site managers can target power costs site by site
- The client ships a spatial, 3D view of the tower portfolio inside its own SaaS product
Engagement
We developed the platform and then maintained it, as an ongoing development and maintenance engagement.