
DWG / DXFGeoJSON / MVT
DWG and DXF to GeoJSON: putting CAD drawings on the map
How to turn AutoCAD floor and site plans into geo-referenced GeoJSON features and vector tiles, keeping layers, colors and line styles.
The problem
Why this conversion is hard
- CAD drawings use local coordinates, usually millimetres or feet from an arbitrary origin, so they do not line up with any map.
- DWG is a closed binary format. Most open-source GIS tools read DXF, but not every DWG version.
- Layers, colors, dashed line styles, arcs and text carry meaning that a naive export throws away.
Our approach
How we do it
- 01
Read the drawing
DXF can be read directly. For DWG we use Autodesk Platform Services, which reads every DWG version reliably.
- 02
Convert entities to features
Lines, open and closed polylines, arcs and text become GeoJSON geometries. Arcs are tessellated, and layer, color and line type are kept as properties.
- 03
Geo-reference
A similarity transform (scale, rotation, translation) from two or more control points places the drawing in a projected CRS. Users can fine-tune it by moving and rotating the drawing on the map.
- 04
Serve
Features are reprojected to WGS 84 and served as Mapbox Vector Tiles, so even large site plans stay fast.
Example
A short working example
A starting point to show the idea. Production pipelines add validation, tiling and error handling around it.
import json, math
import ezdxf
from pyproj import Transformer

# Similarity transform from drawing units to a projected CRS (here UTM 43N),
# solved from control points; values below are examples
scale, angle = 0.001, math.radians(12.5)        # mm to m, rotation
tx, ty = 373_500.0, 2_051_200.0                  # drawing origin in UTM
to_wgs84 = Transformer.from_crs("EPSG:32643", "EPSG:4326", always_xy=True)

def to_lonlat(x, y):
    e = tx + scale * (x * math.cos(angle) - y * math.sin(angle))
    n = ty + scale * (x * math.sin(angle) + y * math.cos(angle))
    return to_wgs84.transform(e, n)

doc = ezdxf.readfile("site-plan.dxf")
features = []
for e in doc.modelspace().query("LINE LWPOLYLINE"):
    pts = [e.dxf.start, e.dxf.end] if e.dxftype() == "LINE" else list(e.get_points("xy"))
    closed = e.dxftype() == "LWPOLYLINE" and e.closed
    coords = [to_lonlat(p[0], p[1]) for p in pts]
    geom = {"type": "Polygon", "coordinates": [coords + coords[:1]]} if closed \
        else {"type": "LineString", "coordinates": coords}
    features.append({"type": "Feature", "geometry": geom,
                     "properties": {"layer": e.dxf.layer, "color": e.dxf.color}})

json.dump({"type": "FeatureCollection", "features": features}, open("site-plan.geojson", "w"))
Pitfalls
What usually goes wrong
- Check $INSUNITS in the DXF header before assuming millimetres.
- Blocks (INSERT entities) must be exploded with their own scale and rotation.
- Text height and rotation need to become label properties, not geometry.
- Keep the transform parameters with the data so the placement can be edited later.
Case studies
Where we have done this
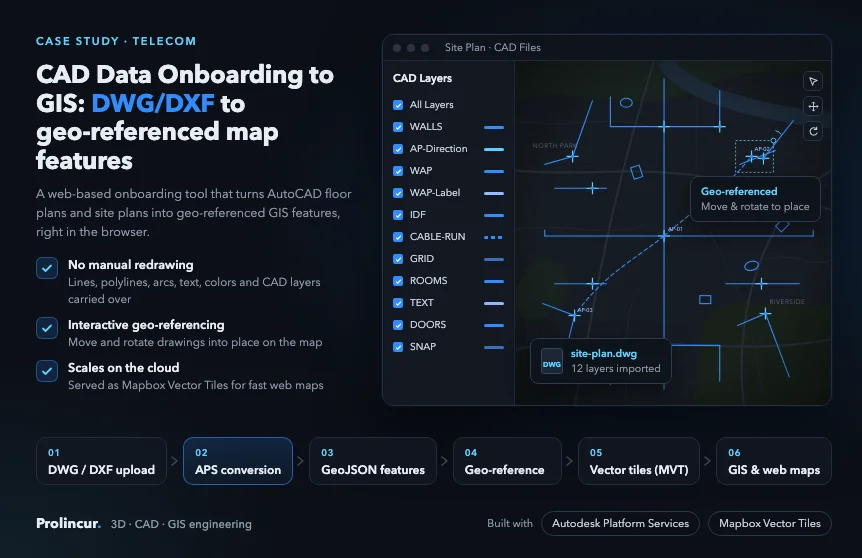
Telecom
CAD Data Onboarding to GIS
AutoCAD DWG and DXF floor and site plans turned into geo-referenced map features with Autodesk Platform Services.
Read case study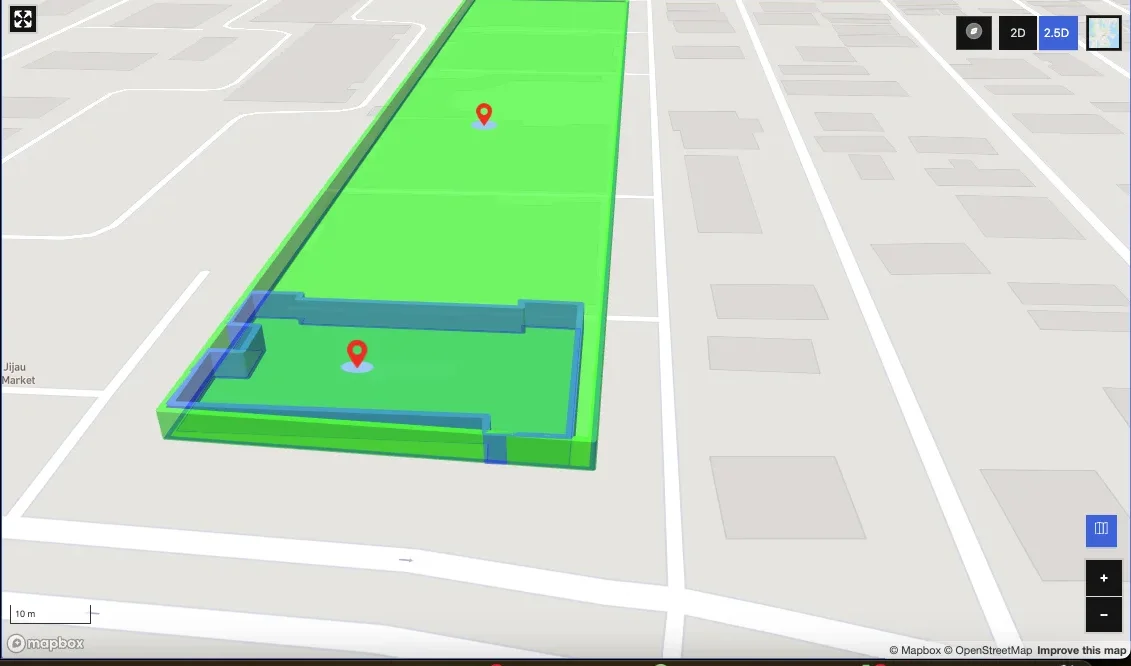
GIS / Urban planning
Map-Based Drawing Tool in 2D, 2.5D and 3D
A Mapbox drawing and editing tool to create, import and manage custom real estate features on a map.
Read case study
Want this done on your own DWG / DXF files?
Our CAD to Map accelerator is fixed scope and fixed price. Start with a free sample file, or talk to an engineer.